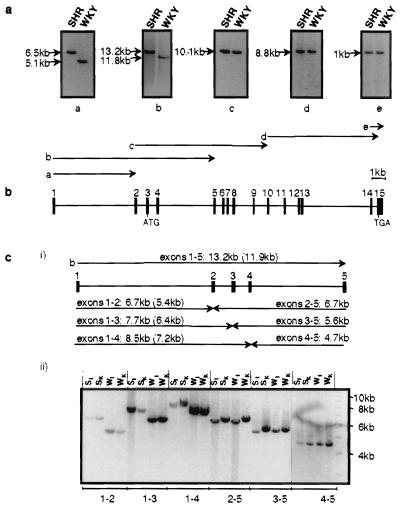
Figure 4.
Comparison by using PCR of the SA gene of SHR and WKY rat. (a) Products obtained by amplification across different exon as indicated by arrows a-e in b (see Results for explanation of size differences). (b) The exon/intron organization of the SHR SA gene. Filled rectangles represent exons (see Table 1 for exon and intron sizes). (c) Detailed PCR analysis of exons 1–5. (i) Diagram of SHR SA exons 1–5 with arrow b corresponding to the PCR product shown in Fig. 5a. The arrows below the exon/intron map denote the products expected by amplification across specific exons. Figures in brackets correspond to the (smaller) WKY product sizes caused by the absence of the LINE insertion in intron A. (ii) Corresponding PCR Analysis. All PCR products agreed with their predicted sizes and show no evidence of intragenic exon duplication.

