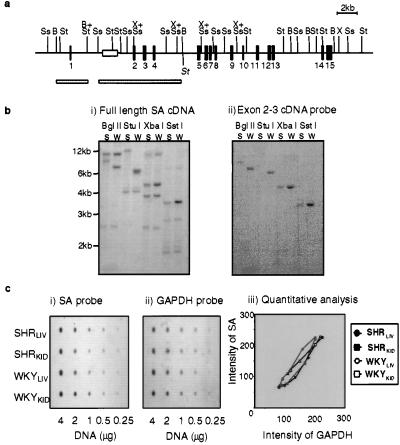
Figure 5.
Restriction mapping of SHR and WKY SA genes. (a) Restriction map of the SHR SA gene. The map was constructed by positioning fragments generated by digestion of SHR DNA with BglII (B), StuI (St), XbaI (X), and SstI (Ss) and probing with the 2-kb SA cDNA probe or subprobes corresponding to specific regions of the SA cDNA. Black boxes correpond to exons. The white box in intron A represents a previously characterized LINE insertion (19); the hatched boxes underneath restriction map denotes regions of the SA gene that were fully sequenced, and the StuI point mutation in intron D is shown in italics. (b) Southern blot analysis of SHR and WKY kidney SA gene structures. All bands could be mapped to the single copy structure of the gene shown in a. Because of the small size of exon 1 (67 bp), neither the restriction fragments that contained only exon 1 nor the 500-bp StuI fragment of exon 13 was easily visible on the autoradiograph. The blot was hybridized with a 2-kb SA cDNA probe (i) and an exon 2–3-specific SA cDNA probe (ii). (c) Dot-blot analysis of SHR and WKY liver and kidney SA DNA. SA genomic DNA was quantified by successive hybridization of serial dilutions of each DNA to an SA cDNA probe (i), a probe for glyceraldehyde-3-phosphate dehydrogenase (GAPDH) (ii). (iii) Quantitative analysis of the dot blots is shown.

