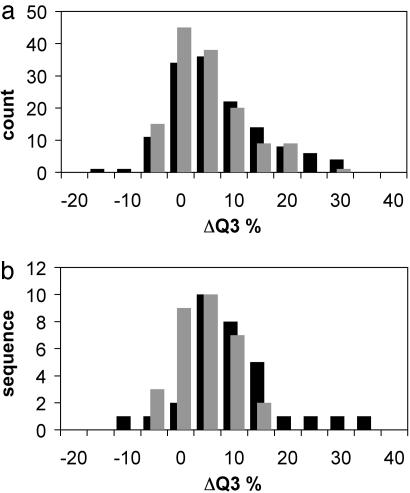
Fig. 3.
Histogram of the change in secondary structure prediction accuracy (Q3) resulting from inclusion of low-resolution tertiary structure information from the native structure (black bars) or rosetta models (gray bars) in the neural network secondary structure prediction. The change in Q3 is shown on the horizontal axis, with count (a) or sequence (b) shown on the vertical axis. The average improvement for the independent set of 137 structures (a)is7% and 5%, respectively, and for the combined set of LIVEBENCH6 and CAFASP3 targets (b) is 10% and 4%, respectively.

