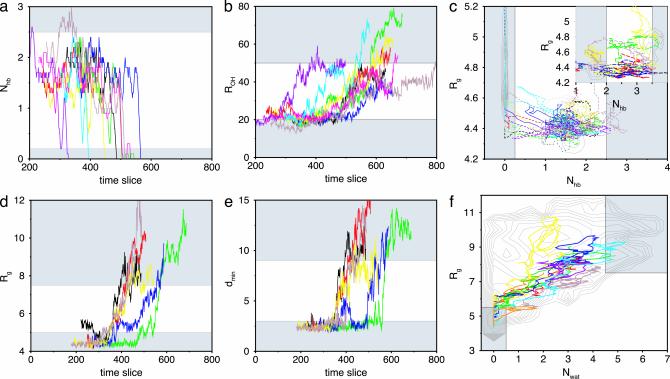
Fig. 2.
Order parameters for typical pathways in the path ensembles plotted as a function of time-slice index. Gray areas indicate stable states. (a) Number of backbone hydrogen bonds, Nhb, in the F-H ensemble. (For clarity, the data are smoothed by taking a 10 time-slice running average along the path. Because of this averaging, some of the paths seem unable to reach the stable states.) (b) Sum of distances, ROH, in the F-H ensemble. (c) Combination of the paths in the N-F (long dashed lines) and F-H (dashed lines) ensembles in the (Nhb, Rg) plane together with approximate stable-state contours obtained by straightforward MD. (d) Core radius of gyration, Rg, in the H-U ensemble. (e) Minimum distance, dmin, in the H-U ensemble. (f) A few paths of the H-U path ensemble in the (Nwat, Rg) plane together with an approximate free-energy contour plot as obtained by a straightforward MD calculation of the U state.

