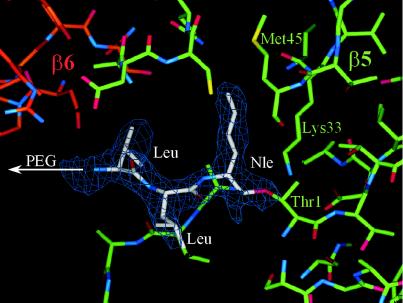
Figure 3.
Part of the electron density map with 2Fo-Fc coefficients after 2-fold averaging of the yeast 20S proteasome/(PEG)19–25-[NH-CO-(CH2)2-CO-Leu-Leu-Nle-H]2 (8) complex. The electron density map was calculated with phases of the free enzyme structure and contoured around the inhibitor molecule at 2ó cutoff. The carbon atoms are marked with different colors: green for β5, red for β6, and white for the inhibitor.

