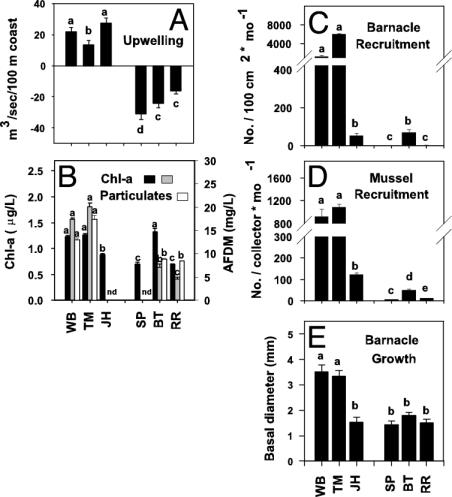
Fig. 3.
Mean (+1 SE) of 1990–2002 Bakun upwelling indices (A); average chl-a concentration 1999–2002 (black bars) and chl-a (gray bars) and total particulates (white bars) in December 2001 and January 2002 (n = 5 each) (B); and rates of recruitment (n = 8 each) (C and D) and barnacle growth (n = 5) (E). Bars with different lowercase letters adjacent to them differ at P < 0.05. In nested ANOVA, upwelling differed between coasts (1,4 df, P = 0.0005) and among sites (4,894 df, P = 0.0019). (B) Chl-a and particulates differed among sites [site (coast) and site (transport regime), P < 0.0001 for both). Overall average chl-a and 2001–2002 chl-a, respectively, did not differ with either coast (P > 0.41, P > 0.16) or transport regime (P = 0.11, P = 0.34), but particulates were marginally greater on the west coast (P = 0.06).

