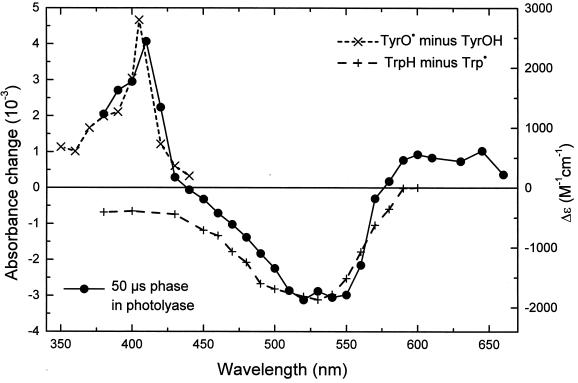
Figure 3.
Spectrum of the t = 50-μs phase (left-hand scale; ●) attributed to electron transfer from a tyrosine residue to a tryptophanyl radical. The data result from a fit to transients like those shown in Fig. 2. Difference spectra for the oxidation of tyrosine (×) and for reduction of the neutral tryptophan radical (+) were obtained from refs. 30 and 31, respectively (right-hand scale).

