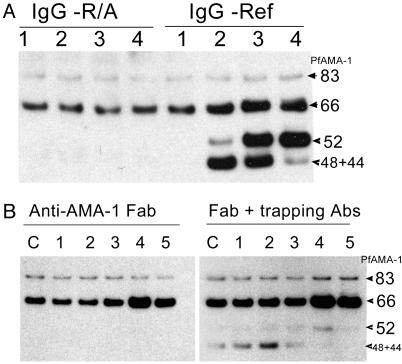
Fig. 4.
(A) Processing assay showing the effects of IgG against reduced and alkylated AMA-1 (IgG-R/A) and refolded AMA-1 (IgG-Ref) proteins. IgG concentrations in lanes 1–4 were 0.00035, 0.0035, 0.035, and 0.35 mg/ml, respectively. (B) Processing assay showing the effect of anti-AMA-1 Fab fragments. Fab fragment concentrations in lanes 1–5 were 0.000014, 0.00014, 0.0014, 0.014, and 0.14 mg/ml, respectively. C indicates media control. A parallel assay with trapping antibodies (1:2,500 postimmune pool) is also shown.

