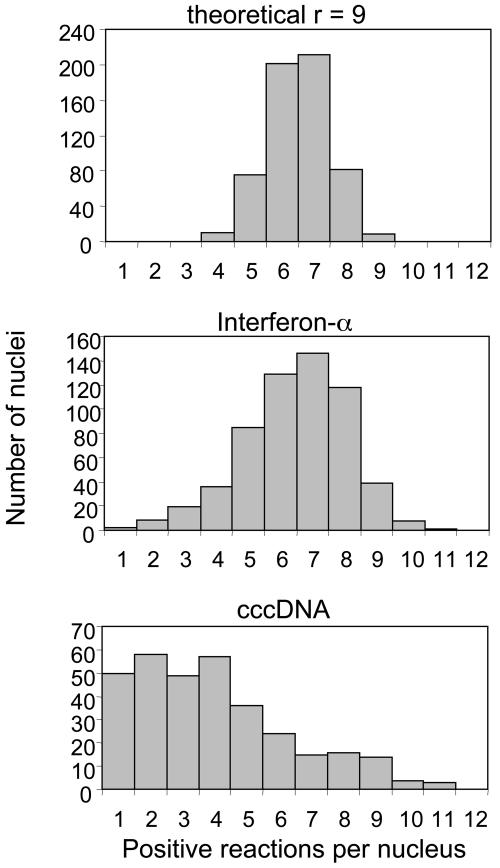
Fig. 4.
Distribution of positive reactions for all nuclei. (Top) The theoretical distribution of 9 templates among 12 reactions, assuming 100% detection of each template. (Middle and Bottom) The distributions for the number of positive reactions per nucleus for the combined data from six biopsies. Only nuclei showing at least one positive reaction for IFN-α (Middle) or cccDNA (Bottom) are included in the distributions.

