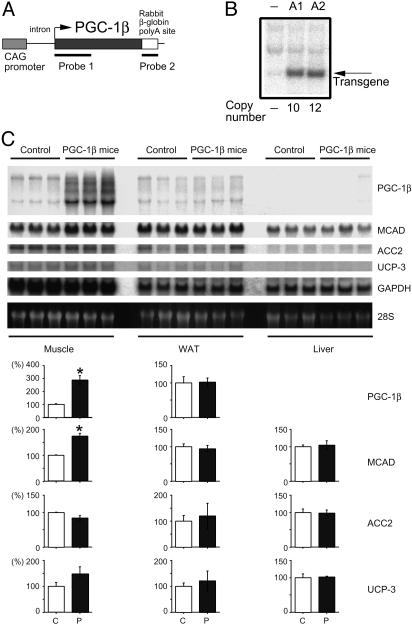
Fig. 3.
Creation of PGC-1β mice. (A) A schematic drawing of the PGC-1β transgene and the positions of probes used for Southern (probe 1) and Northern (probe 1 and 2) blots are shown. (B) Two transgenic lines (A1 and A2) were established, containing 10 and 12 copies of the transgene, respectively. (C) Northern blot analysis on the skeletal muscle, WAT, and liver from 8-week-old PGC-1β (line A1) and control mice. Each lane contained 20μg of total RNA. mRNA expression of PGC-1β, MCAD, ACC2, UCP-3, and control GAPDH were examined. Three age-matched male mice in each group were used. Quantification of Northern signals (control as 100%) is shown under the panels. Data are represented as the mean ± SEM (*, P < 0.05). C, control mice; P, PGC-1β mice.

