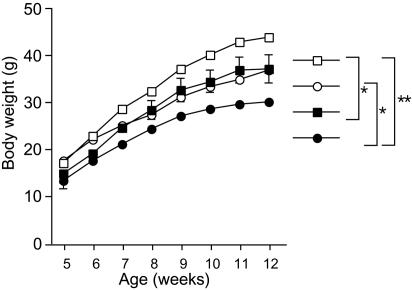
Fig. 5.
Breeding of PGC-1β mice and genetically obese KKAy mice. Body weights of KKAy (+) PGC-1β (-)(□; n = 8), KKAy (-) PGC-1β (-)(○; n = 5), KKAy (+) PGC-1β (+) (▪; n = 5), and KKAy (-) PGC-1β (+) (•; n = 5) male mice were measured weekly. Values represent mean body weight ± SEM. For some data points, the error bars are smaller than the symbols. Body weight curves of each group were compared by one-way repeated-measures ANOVA. *, P < 0.05; **, P < 0.01.

