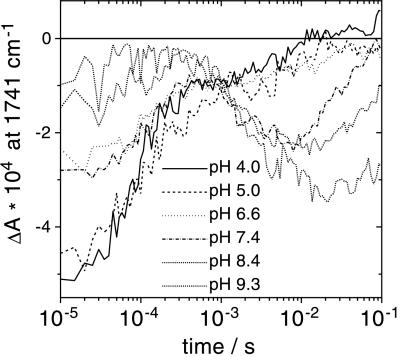
Figure 2.
Time traces of absorbance changes at 1741 cm−1. Data are from step-scan experiments at different pH values. The negative signal at late times is attributed to deprotonation of D96 during the lifetime of the N intermediate. It is a measure of the transient concentration of deprotonated D96.

