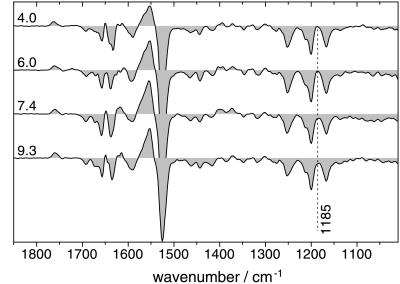
Figure 4.
Representative M-BR difference spectra from time-resolved measurements at various pH values. Spectra have been extracted from step-scan data at a mean time of 400 μs (±100 μs) after the laser flash—i.e., at a time where the transient M concentration is at maximum. The time of maximum M concentration is almost invariant to the pH within the pH range under study (see figure 1 in ref. 15). The absorption difference at 1185 cm−1 indicates the purity of the M state (see text). Spectra have been scaled to equal intensity at 1525 cm−1 and 1200 cm−1 (C⩵C and C—C stretch of ground-state retinal).

