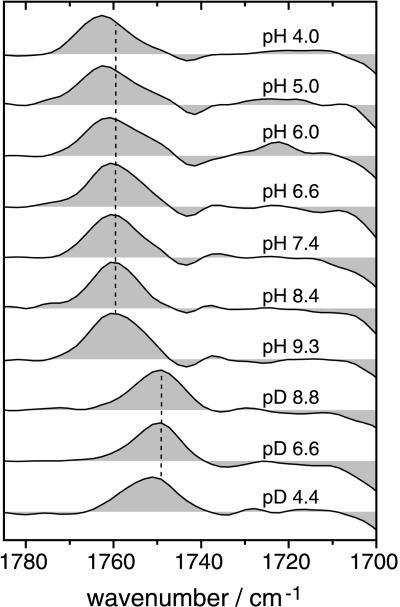
Figure 5.
M-BR difference spectra in the carbonyl region. Experiments were performed in H2O (upper seven spectra) and in 2H2O (D2O; lower three spectra) at the indicated pH and pD, respectively. The dotted vertical line indicates that the C⩵O stretching vibration of D85 is shifted to higher wavenumbers at acidic pH as compared with neutral and alkaline pH. The corresponding band at pD 4.4 is analogously shifted.

