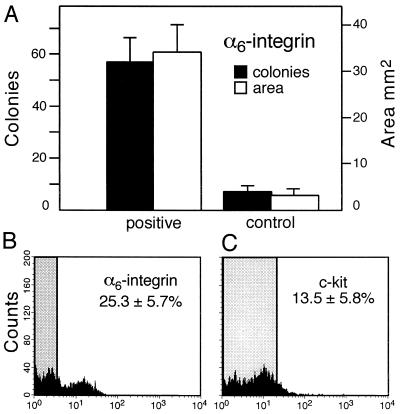
Figure 5.
Expression of α6-integrin on spermatogonial stem cells. (A) Enhanced colonization of recipient testes by transplanted ROSA26 donor cells selected with anti-α6-integrin antibody. Approximately 10 μl of cell suspension (107 cells per ml) was injected into each testis (see Materials and Methods). Degree of colonization in three experiments is represented by number of individual blue colonies and by total blue area (mean ± SEM; n = 15 experimental and control testes). Difference between selected and unselected cells is significant (P < 0.001). (B) For flow cytometric analysis, cells selected with anti-α6-integrin antibody were treated with FITC-conjugated antibody. The fluorescence of α6-integrin selected cells was compared with similar cells not treated with FITC-conjugated antibody. The shaded area shows the range of fluorescence of controls. The average percent of high fluorescing α6-integrin cells above the control range in three experiments was 25.3 ± 5.7 (mean ± SEM). The value for unselected cells was 1.9 ± 0.4 (not shown). (C) Cells selected as in B were treated with anti-c-kit antibody conjugated to PE and analyzed as above. The average percent of high fluorescing c-kit-expressing cells above the control range (shaded area) in the α6-integrin selected cell population in three experiments was 13.5 ± 5.8 (mean ± SEM). The value for unselected cells was 6.1 ± 1.3 (not shown).

