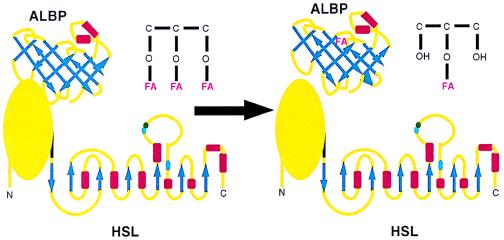
Figure 5.
Proposed effects of the interaction of HSL and ALBP. The HSL diagram (Lower) depicts the C-terminal portion of HSL as α/β-hydrolase folds based on models of its secondary structure, whereas the N-terminal portion is depicted as a globular protein because its structure does not fit any current predicted models. The ALBP diagram (Upper) depicts a β-barrel. β-sheets are depicted as blue arrows and α-helices as red rectangles. See text for a description of the interaction of HSL and ALBP.

