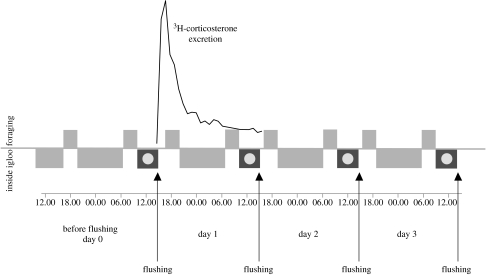
Figure 1.
Sampling design during the flushing experiment. The light grey-shaded blocks show the approximate average duration of dawn and dusk foraging bouts (above the x-axis, which depicts time) and of igloo resting (below the same axis) in our three free-ranging, experimentally disturbed birds. The arrows depict approximate time of flushing and faeces collection. The dark grey blocks marked with a circle indicate the period during which faecal material collected for the analysis was deposited inside snow burrows. Black line: temporal pattern of a corticosterone excretion curve (redrawn from Baltic et al. 2005) after injection of 3H-corticosterone, as retrieved from the droppings excreted in a chronological sequence by four black grouse in captivity. After a peak within 1–3 h after administration, the concentrations of corticosterone metabolites progressively decreased to almost baseline levels after 24 h.

