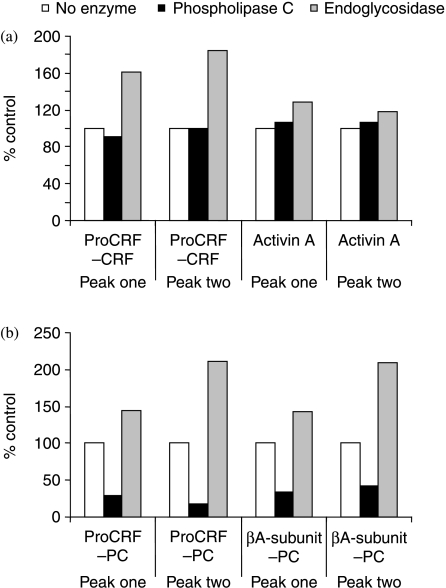
Figure 5.
The effect of enzyme treatment on the immunoreactivity of pro-CRF-PC and pro-βA-PC. Peak one represents a pool of fractions 36–37 and peak two, a pool of fractions 41–43 from Fig. 4, which were freeze-dried separately before being reconstituted in assay buffer. Open histogram represents ELISA assay result with no enzyme treatment, black histogram after phospholipase C digestion and grey histogram after endoglycosidase digestion. Values are the means of duplicate determinations in the respective two-site immunometric assay.

