Figure 3.
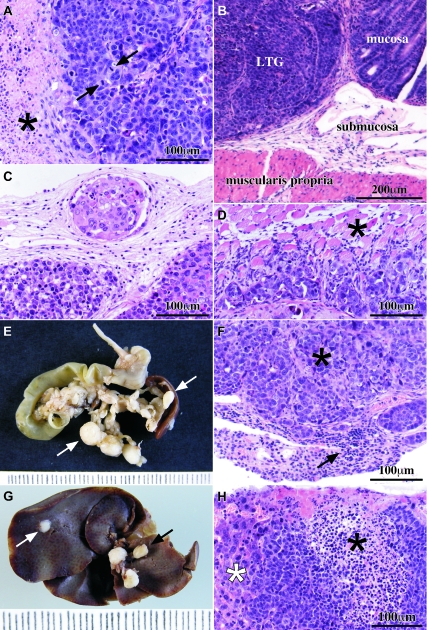
Pathology findings and tumor spread. A: Microscopically, the tumor had the features of a poorly differentiated adenocarcinoma with cells arranged in sheets and extended necrotic areas (black asterisk). Very few glandular lumens were seen. Highly atypical nuclei and frequent mitoses were observed (black arrows). B: Local tumor growth (LTG) at the injection site began at the submucosa and extended through all of the layers of the cecal wall. C: Tumor cells were found inside lymphatic and blood vessels adjacent to the tumor at the injection site in the cecum. The lymphatic depicted here was located in the subseroral connective tissue under the local tumor growth. D: Tumor cells were found infiltrating the peritoneal surface of the diaphragm and reaching the muscle fibers (black asterisk). E: Mesenteric lymph node and pancreatic metastases were seen as white and rounded masses (white arrows). F: Lymphocytes (black arrow) in metastasized lymph nodes were displaced to the periphery of the node by the tumor deposit (black asterisk). G: Macroscopic view of the liver surface infiltrated by tumor cells. Lymph nodes from the hepatic hilium (black arrow) were metastasized in some cases. Tumor deposits at the liver were always seen under the hepatic capsule (white arrow). H: Liver parenchyma (white asterisk) infiltrated by tumor cells (black asterisk). A, B, C, D, F, and H are H&E-stained sections.

