Figure 4.
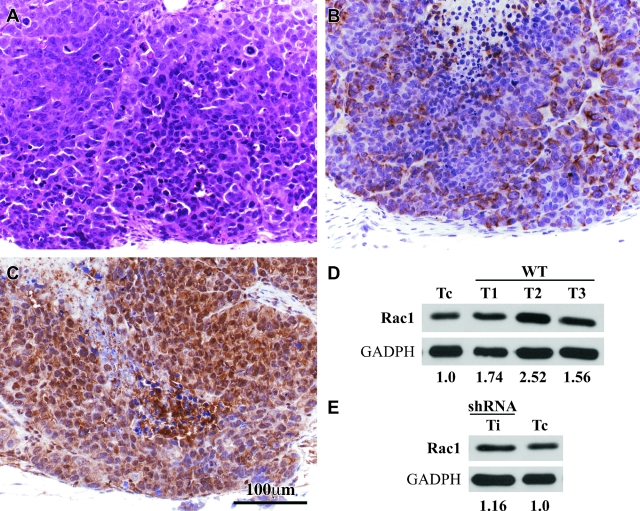
Expression of Rac1 in tumors samples. A: An adjacent section of C was stained with H&E to show the microscopic features of the tumor. B: An adjacent section of C was stained with antibodies against vimentin showing cytoplasmic immunostaining of many tumor cells. C: A tumor section stained with antibodies against Rac1. The antibody stained the cytoplasm of all tumor cells in all of the cases studied. D: Western blot analysis of Rac1 protein in three tumor samples from necropsy of mice. Quantification by densitometry analysis showed overexpression of Rac1 protein. E: The tumor sample corresponding to the iRac1-induced tumor showed re-expression of Rac1. Quantification of Rac1 protein was performed by densitometry analysis. Calibration bar in C also applies to A and B.

