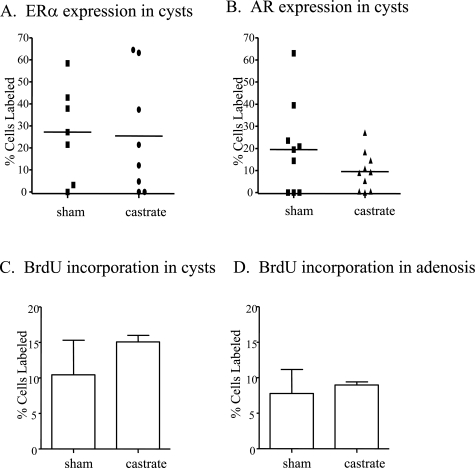
Figure 3.
Effect of castration on ER-α and AR expression in macrocysts and proliferation in mammary lesions of NRL-TGF-α/PRL male mice. Percentage of ER-α+ (A) and AR+ (B) cells present in mammary macrocysts. Each symbol represents a single macrocyst. Proliferation in macrocysts (C) and adenosis lesions (D) was determined as described in Materials and Methods and expressed as mean ± SD.

