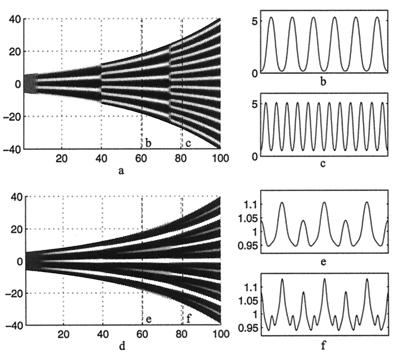
Figure 3.
(a) A space (vertical)—time plot showing the evolution of the morphogen u on a growing one-dimensional domain. (b and c) Cross sections showing the spatial pattern corresponding to the dashed lines in a. Peak doubling is rapid; there is no slow insertion of new peaks. Parameters selected to give rise to the three-peak pattern, corresponding to the number of stripes on the angelfish, Fig. 1a. (d) The corresponding plots of the cell density, showing the gradual insertion of new stripes on the same domain. We use f(u, v) = 0.08u − 0.08v + 0.05 − 0.03u, g(u, v) = 0.1u − 0.15 − 0.06, and set 0 ≤ 0.08 (u − v)+ 0.05 ≤ 0.18 and 0 ≤ 0.1u − 0.15 ≤ 0.5. We set Du = 0.007, Dv = 0.1, Dn = 5.0 × 10⁻⁴, χ0 = −1.0 × 10⁻⁴, k = 1 and the domain growth is given by L(t) = 11.0 exp(10−4 t). Initial conditions are small (±0.5%) random spatial perturbations about the homogeneous steady state for the morphogens and an initially uniform cell distribution, n(x, 0) = 1. Boundary conditions are taken as zero flux for both cells and morphogens.

