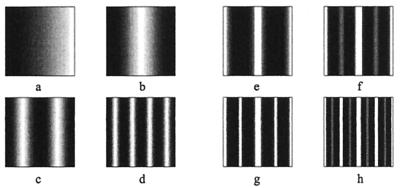
Figure 4.
(a–d) The first three stages of stripe splitting for the chemical u. (a) t = 1,000; (a) t = 5,000; (c) t = 9,000; (d) t = 13,000. The RC:DV ratio is 1.9:0.95 initially, and the growth rate is 0.00018 in the RC and 0.00022 in the DV directions. The evolution of the cell density is shown in e–f. (e) t = 12,000; (f) t = 14,000; (g) t = 16,000; (h) t = 18,000. Insertion of new stripes is gradual. For convenience we have rescaled the domain to a fixed size. The equations are solved by using an Alternating Direction–Implicit scheme with 101 × 101 grid. Parameters, kinetics and initial and boundary conditions are as in Fig. 3.

