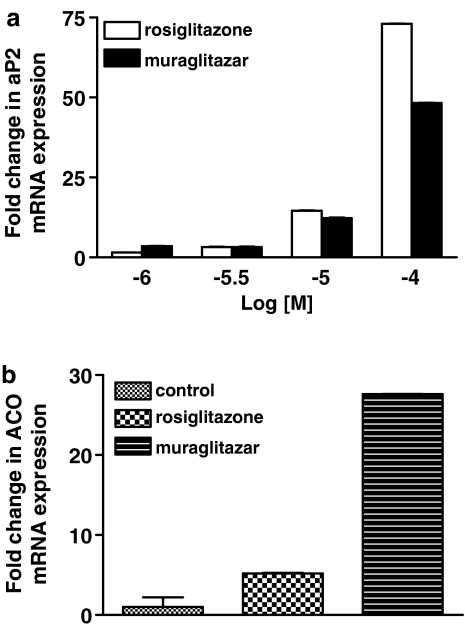
Figure 1.
(a) Relative quantitation of aP2 mRNA expression by rosiglitazone and muraglitazar as determined by semiquantitative RT-PCR. Confluent 3T3-L1 cells were incubated for 5 days with various concentrations of PPAR-γ ligands, rosiglitazone, muraglitazar or 0.1% DMSO (as vehicle control) and RNA was isolated as described under ‘Methods'. aP2 mRNA levels were normalized by endogenous 18S control. Data shown are means±s.d. of duplicate determinations. A representative bar graph is shown. In (b) mRNA expression of ACO after 14 days treatment with muraglitazar (10 mg kg−1) and rosiglitazone (10 mg kg−1); n=2.

