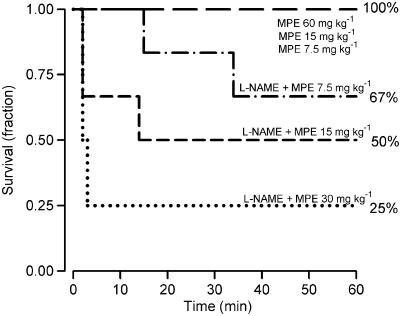
Figure 4.
Survival curves resulting from MPE in different groups. The lines represent the survival proportion during the first 60 min after MPE (administered at time 0) for the non-pretreated groups; MPE of 60 (group 1a, n=6), 15 (group 1b, n=5) or 7.5 mg kg−1 (group 1c, n=5) and the L-NAME (30 mg kg−1 i.v.) pretreated groups (MPE of 30 (group 2a, n=4), 15 (group 2b, n=6) or 7.5 mg kg−1 (group 2c, n=6)).

