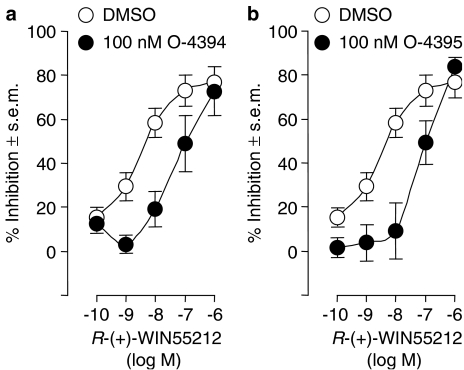
Figure 3.
The effect of pretreatment with (a) 100 nM O-4394 or (b) 100 nM O-4395 on the mean log concentration–response curve of R-(+)-WIN55212 in the mouse isolated vas deferens. Each symbol represents the mean value (and vertical lines show s.e.m.) for inhibition of electrically evoked contractions expressed as a percentage of the amplitude of the twitch response measured immediately before the first addition of R-(+)-WIN55212 to the organ bath. O-4394, O-4395 or DMSO was added 30 min before the first addition of R-(+)-WIN55212, further additions of which were made at 15 min intervals. Each log concentration–response curve was constructed cumulatively without washout (n=7). Mean apparent KB values of O-4394 and O-4395 for their antagonism of R-(+)-WIN55212 have been calculated from these data and these values are listed in Table 1.

