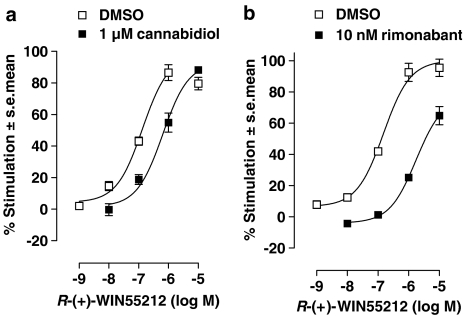
Figure 2.
[35S]GTPγS binding to mouse brain membranes. The effect of (a) 1 μM cannabidiol (n=6) or (b) 10 nM rimonabant (n=5) on the mean log concentration–response curve of R-(+)-WIN55212 for stimulation of [35S]GTPγS binding to mouse whole-brain membranes. Each symbol represents the mean percentage increase in [35S]GTPγS binding±s.e.m. The mean apparent KB values of cannabidiol or rimonabant for their antagonism of R-(+)-WIN55212, with 95% CI in parantheses were 0.3 nM (0.16 and 0.52 nM) and 138 nM (87 and 225 nM), respectively.

