Figure 3.
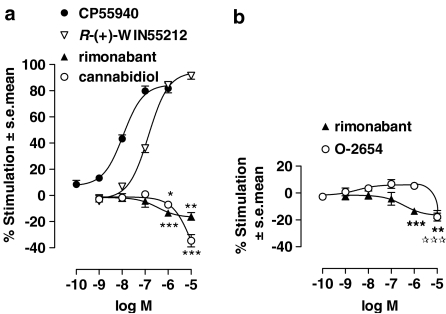
[35S]GTPγS binding to mouse brain membranes. The effect of (a) CP55940 (n=9), R-(+)-WIN55212 (n=7–8), rimonabant (n=7–8) and cannabidiol (n=6) or (b) rimonabant (n=7–8) and O-2654 (n=6–10) on the level of [35S]GTPγS binding to mouse whole-brain membranes. Each symbol represents the mean percentage change in [35S]GTPγS binding±s.e.m. In (a), asterisks (*) denote rimonabant and cannabidiol values and in (b), asterisks (*) or open stars (⋆) denote rimonabant or O-2654 values, respectively, which are significantly different from zero (*P<0.05, **P<0.005, ***P<0.001; one-sample t-test). The mean EC50 and Emax values of these cannabinoids are listed in Table 2.

