Figure 1.
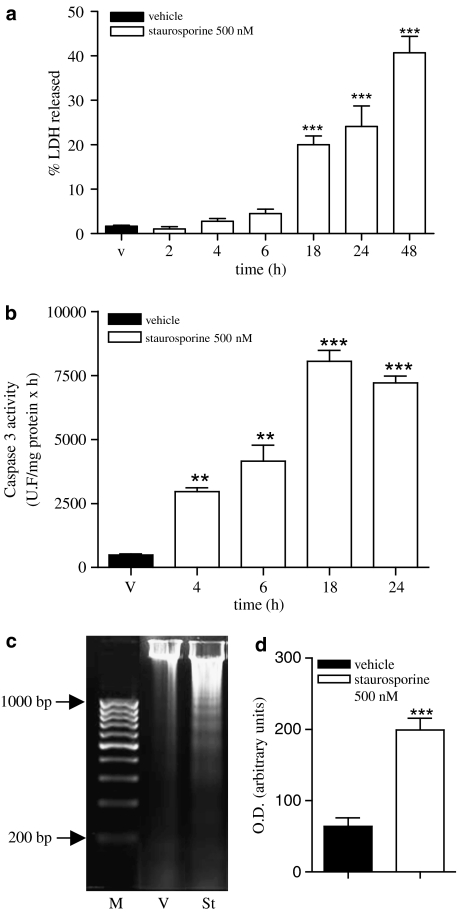
Effect of staurosporine (500 nM) on SH-SY5Y neuroblastoma cell line. (a) Time course of staurosporine-induced cell death. Release of LDH is expressed as percentage of total LDH content in the cell at the beginning of the experiment. Data represent mean+s.e.m. of 12 experiments. **P<0.01 as compared to vehicle-treated cells (v). (b) Time course of staurosporine-induced caspase 3 activity in total lysates. Caspase 3 activity was measured as indicated in Methods. Data are expressed as mean±s.e.m. of 12 experiments. **P<0.01 ***P<0.001, compared to vehicle-treated cells. (c) DNA fragmentation in SH-SY5Y cells treated with vehicle (v) or staurosporine (St) 500 nM for 24 h. Nucleosomal fragmentation was visualized by agarose gel electrophoresis. M indicates DNA size markers. Data shown are representative of three different experiments. (d) Densitometric analysis of low-molecular weight DNA fragments extracted from vehicle- or staurosporine-treated cells. Optical density is expressed in arbitrary units. Data are expressed as mean±s.e.m. of three experiments. ***P<0.001 compared to vehicle-treated cells.

