
Figure 1.
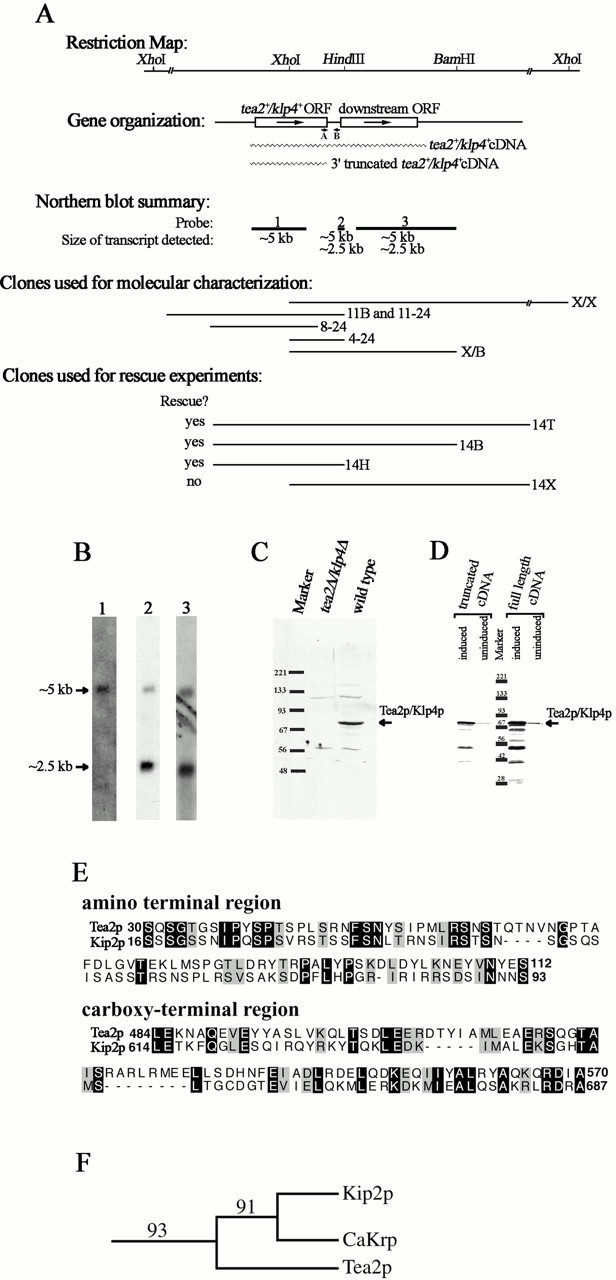
Molecular analysis of tea2 +. (A) Schematic representation of the tea2 + genomic region. The top section is a restriction map (additional HindIII and BamHI sites not shown). The second section illustrates the gene organization with a schematic representation of the ORFs. Arrows indicate the direction of transcription, and wavy lines represent the cDNA clones used in D. The short lines labeled A and B represent the location of the primers used for RT-PCR, which is described in the text. The third section is a summary of the results from the Northern blot analysis shown in B. Lines designated 1, 2, and 3 represent coverage of probes used for the Northern blot analysis, with the size of the transcript detected for each probe written under the line. The fourth section illustrates the clones used for molecular analysis, which are described in the text. Section five shows clones used for rescue experiments. All sections are aligned with the restriction map. (B) Transcriptional analysis of the tea2 + region. Probes designated 1, 2, and 3 in A were hybridized to polyA+ RNA isolated from wild-type cells. (C) Western blot analysis. Protein extracts were obtained from tea2Δ and wild-type cells in logarithmic growth. The blot was reacted with antibodies to Tea2p. The upper and lower background bands appear with variable intensities from blot to blot. (D) Western blot analysis of cDNA transformants. For expression of the full-length and truncated cDNAs, cells transformed with pREP3Xtea2 +cDNA and pREP3Xtea2 +ORF were used. The blot was reacted with antibodies to Tea2p. (E) Sequence alignment. Nonmotor regions of Tea2p and Kip2p were aligned using BestFit and displayed using BOXSHADE. Identical aa are highlighted in black, and similar aa are highlighted in grey. (F) Bootstrap analysis. The branch structure shows the Kip2p subfamily of the kinesin superfamily. The numbers illustrate bootstrap values for 100 replicas.