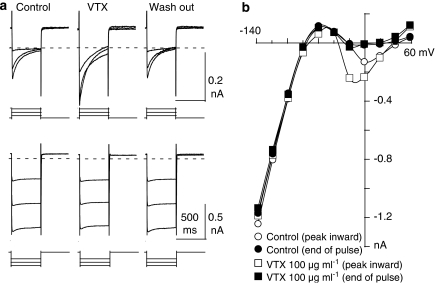
Figure 2.
Effects of verrucotoxin (VTX) on Ca2+ and K+ currents. (a) Test pulses of 500 ms duration were applied every 10 s from −40 to −20 mV, 0 and 20 mV for the upper panel, and −140, −120 and −100 mV for the lower panel in the absence (left row), presence (middle row) or wash out (right row) of 100 μg ml−1 VTX. The broken lines indicate the zero current level. X axis scale bar: 500 ms. (b) Current–voltage (I–V) relationships for the same cell shown in (a) in the control experiment and in the presence of 100 μg ml−1 VTX. Open and filled symbols represent the peak inward current and current level at 500 ms after the onset of the clamp pulse, respectively.

