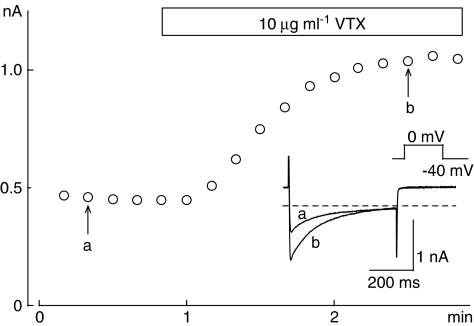
Figure 4.
Time course of the changes in L-type Ca2+ currents (ICa(L)) during the application of 10 μg ml−1 verrucotoxin (VTX). ICa(L) was elicited by 500 ms depolarizing pulses from −40 to 0 mV every 10 s. The current amplitude was measured as the difference between the peak of ICa(L) and the current at the end of the pulse, and plotted against the experimental time. In the inset, original current traces recorded at the times indicated on the graph (a, b) are shown.

