
Figure 6.
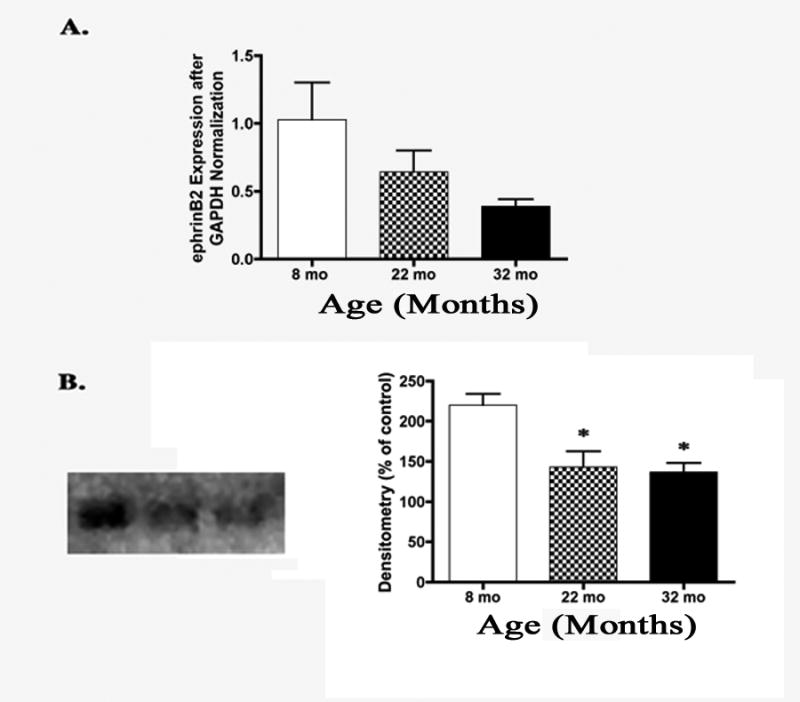
(A) Bar graph of real time PCR steady state mRNA expression of ephrinB2 showed a trend to decrease from 8 months to 32 months of age. However, it did not decrease to a point of significance (N=7). (B) Representative western blot analysis and densitometry showed a significant decrease of ephrinB2 protein levels at 22 months and 32 months compared to 8 months of age (N=6, *P<0.01).