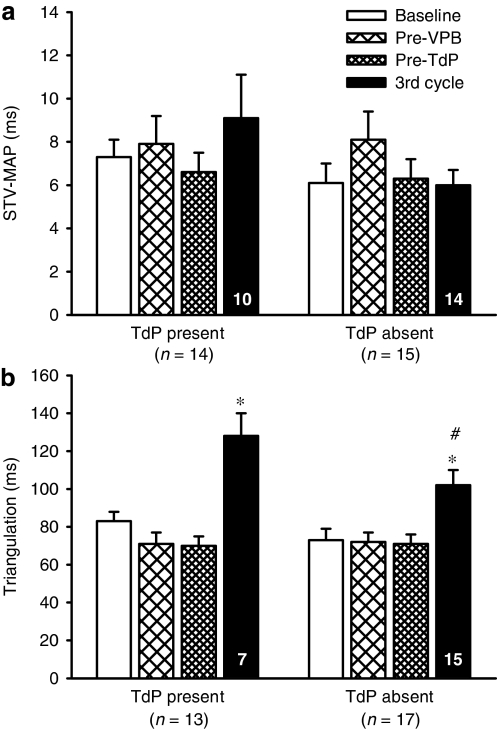
Figure 8.
Pooled data from both the HMR and ATX studies illustrating (a) short-term variability in MAPD90 (STV-MAP) and (b) triangulation of the action potential in rabbits with TdP and those in which TdP was absent. Values are mean±s.e.mean. *P<0.05 compared to all other time points, one-way ANOVA, #P<0.05 compared to TdP present, unpaired t-test. Numbers in columns indicate n-values where these are less than the group value.

