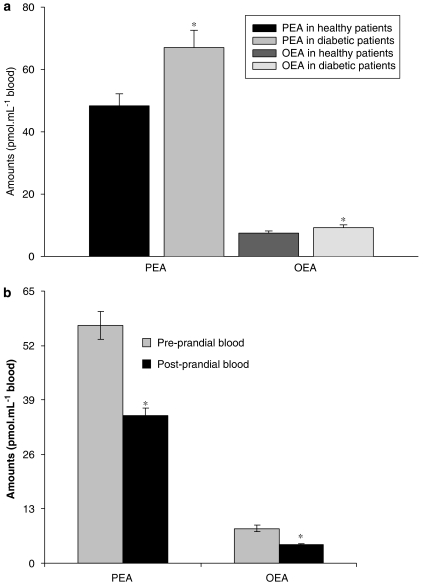
Figure 6.
(a) Blood oleoylethanolamide (OEA) and palmitoylethanolamide (PEA) levels in overweight type 2 diabetes (T2D) vs healthy volunteers. Data are means±s.e.mean of n=8 healthy volunteers and n=10 T2D patients. (b) Blood OEA and PEA levels in postprandial vs preprandial healthy normoweight volunteers. Blood sampling was carried out 1 h before and after the meal, respectively. Data are means±s.e.mean of n=12 subjects. *=P<0.05 vs controls, respectively, as assessed by the Kruskal–Wallis nonparametric test (a), or the two-tailed paired Student's t-test (b).

