
Fig. 6.
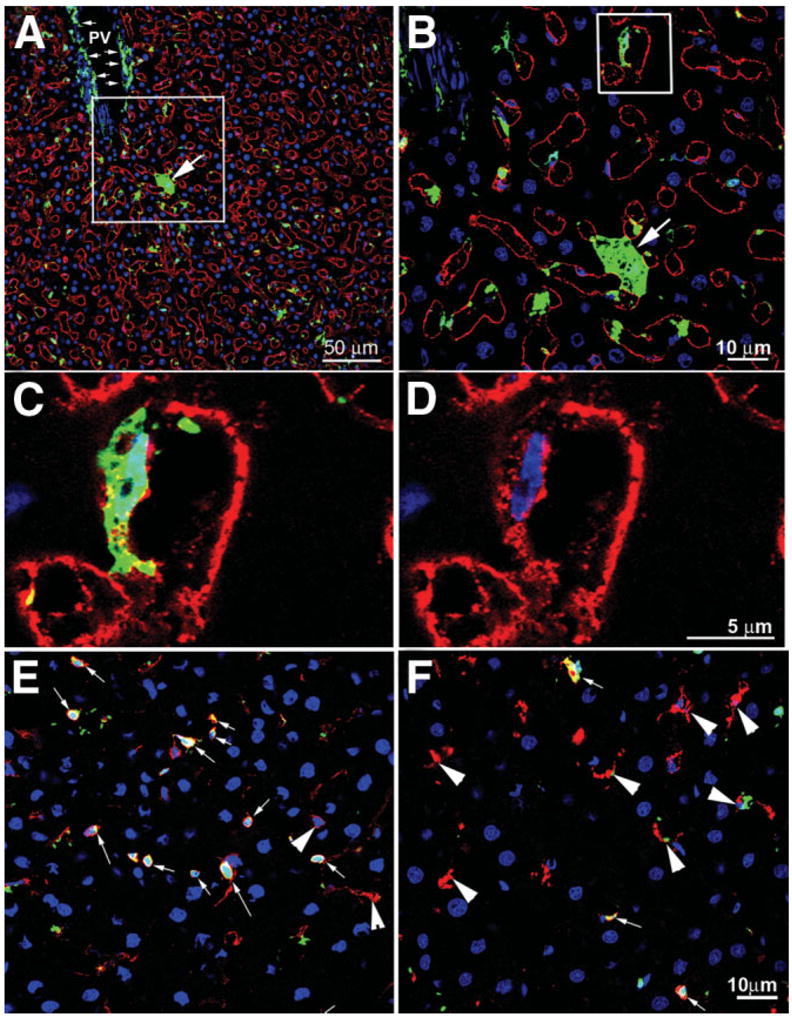
EGFP+ BM-derived recipient cells integrating into WT donor livers. (A) Liver harvested from a WT liver transplanted into an EGFP+ recipient 36 days after 18-hour CIT and OLTx. Liver was stained for nucleus (blue) and SE-1 (red). Many EGFP+ cells are scattered throughout the liver, including an EGFP+ hepatocyte (arrow) as well as many perivascular cells surrounding the portal vein (PV, small arrows) and intrasinusoidal cells. (B) The box from panel A is magnified to show the EGFP+ hepatocyte (arrow) as well as an EGFP+ LSEC (box). (C) The box from panel B is magnified to show SE-1+ plasma membrane staining (red) and the EGFP+ and flattened nucleus (blue) of a BM-derived LSEC. (D) Same area as panel C, with the EGFP signal removed to show contiguous SE-1 plasma membrane labeling surrounding a flattened nucleus (blue). (E) Midlobular area colocalizing CD45+ (red) and EGFP+ cells (arrows). Most EGFP+ cells are leukocytes. A few CD45+ cells are not EGFP+ (arrowheads). (F) Midlobular area colocalizing ED1+ cells (CD68, macrophages, Kupffer cells; red) with EGFP+ cells. Very few ED1+ cells are also EGFP+ (arrows), but most are EGFP+ (arrowheads). These data correlate well with the FACS data from isolated sinusoidal cells presented in Table 3.