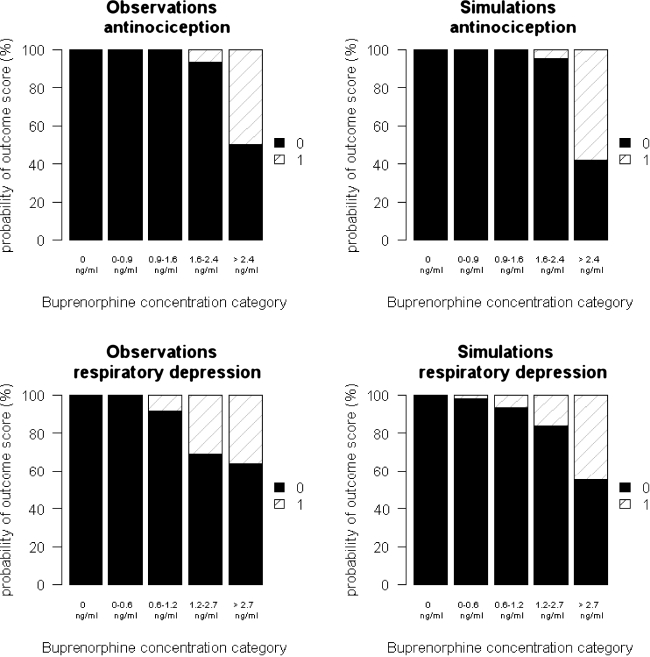
Fig. 3.
Goodness-of-fit plots of the logistic regression model for buprenorphine. Observed (left panels) and simulated (right panels) values of the buprenorphine’s effectiveness (upper panels) and safety (lower panels) outcome for the different concentration categories. Simulations were repeated in total a 100 times. The concentrations were divided in the following categories (scores at Ce = 0, between 0 and 25th quantiles, 25th–50th quantiles, 50th–75th quantiles, >75th quantiles; ■ score = 0 and ⧄ score = 1).

