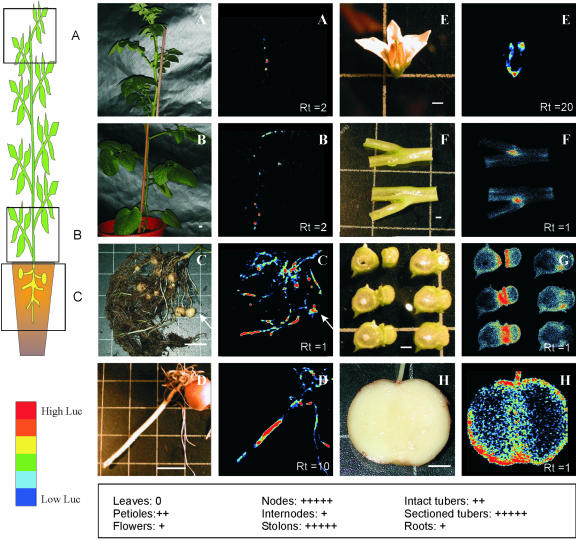
Figure 5.
Expression of the firefly luciferase gene under the control of the potato StCCS promoter. On the left side of this figure, there is a schematic drawing illustrating the organs where luciferase expression has been measured. The second panel includes 16 pictures of the organ(s) measured in the luminometer (left side) and the results of the luciferase measurements (right side). Both pictures of the luciferase activity and corresponding plant organs are displayed with the same amplification. The colors resulting from the luciferase activity range from blue (low activity) to red (high activity) as represented in the lower left corner of the figure. A and B illustrate LUC+ expression in the aerial part, whereas C shows the underground part of a 2.5-month-old potato plant. The part of the plant where measurements A, B, and C were performed is indicated in the drawing next to these pictures. D shows expression in a tuber sprout, E in a flower, F and G in a sectioned stem node, and H in a sectioned tuber. The white bars in A through D correspond to 3.5 cm and in E through H to 0.35 cm. The white arrow in C points to the tuber. Rt, Relative time of luciferase activity measurements. Underneath D and H, an overview of the relative expression in different organs is given (0 corresponds to no activity and +++++ to the highest activity).

