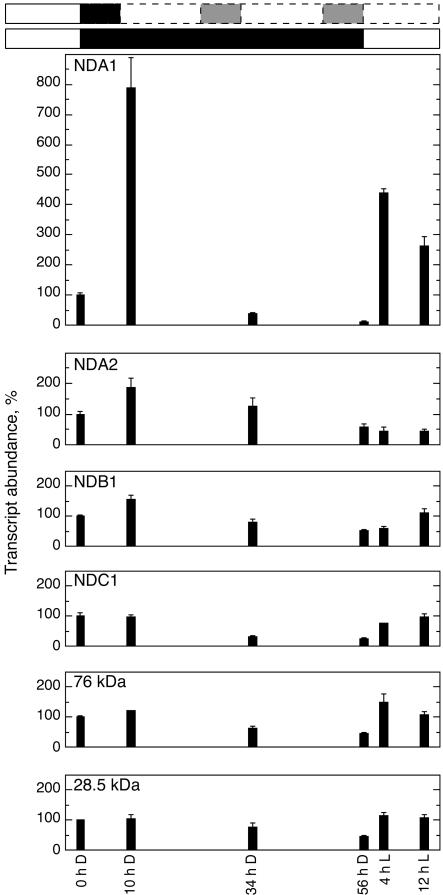
Figure 7.
Effects of light and darkness on the expression of type II NAD(P)H dehydrogenase genes. Plants grown with a photoperiod of 16 h of light (7 am–11 pm) of 100 μmol m–2 s–1, were placed in constant darkness at 11 pm for 56 h, followed by light exposure for 12 h. Leaf samples for RNA extraction and concomitant cDNA synthesis were collected at different time points. White and black boxes, Light and dark treatments, respectively. The entrained rhythm is indicated in white and gray boxes with dashed lines. Hours in darkness (D) and light (L) are indicated below for each investigated time point. Error bars = ses for three separate preparation series.

