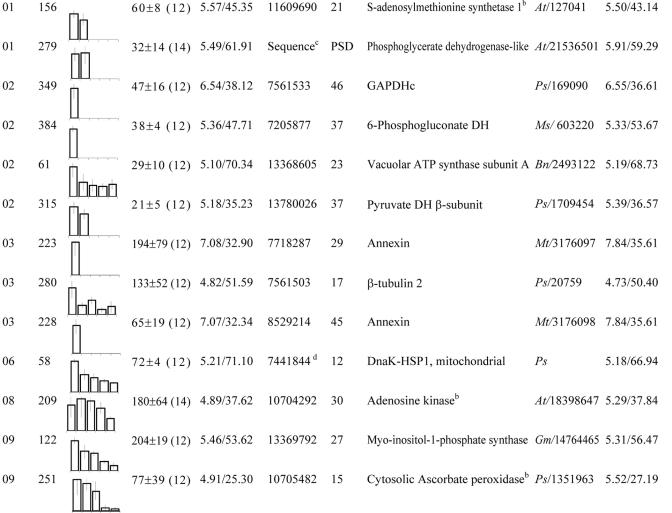
Table III.
M. truncatula polypeptides whose levels decreased (class 2 proteins in Table I) between 12 and 20 DAP
These proteins were grouped according to their biological function (see Fig. 4C). Within each group, spots were classified according to their maximum level detected in 2-D gels between 12 and 20 DAP. No., Spot no. DH, Dehydrogenase. gi, GenBank accession no. Cov, Coverage. At, Arabidopsis. Bn, rapeseed. Gm, soybean. Mtr, M. truncatula. Ms, Alfalfa. Os, Rice. Ps, Pea.

