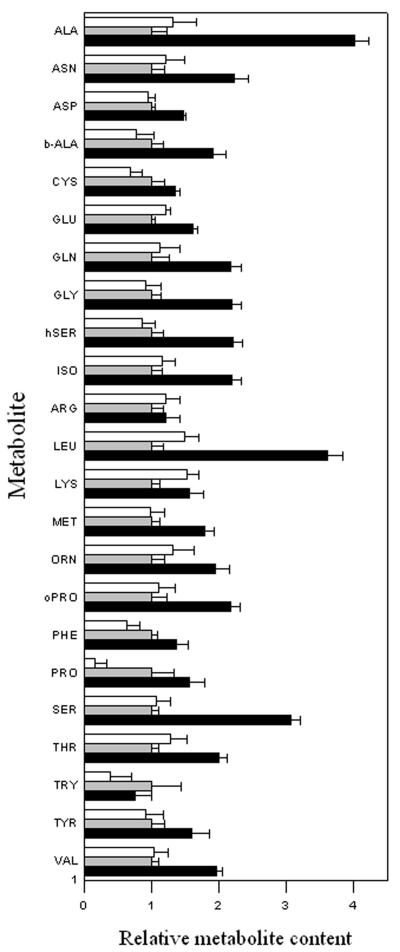
Figure 2.
Relative tuber amino acid levels of potato plants grown under different light conditions. Metabolites were determined as described in “Materials and Methods” from plants grown under low (300 μE, white bar), medium (600 μE, gray bar), or high (750 μE, black bar) light intensities. Data are normalized to the mean response calculated for the 600-μE light intensity samples (to allow statistical assessment, individual samples from this set of plants were normalized in the same way). Values presented are mean ± se of determinations on six individual plants.

