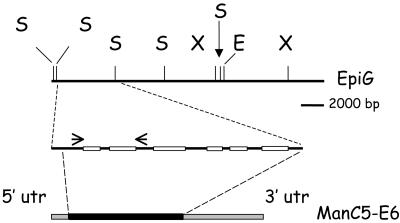
Figure 3.
Schematic representation of the genomic clone EpiG and its alignment to the ManC5-E6 sequence. The top line features the restriction map of the entire EpiG clone with the positions of restriction sites for SalI (S), XhoI (X), and EcoRI (E) and a scale bar. Middle line, Part of EpiG that has been subcloned and aligned to the ManC5-E6 sequence. White sections, Introns; black sections, exons. The PCR primers used for RT-PCR are marked by arrows. Bottom line, ManC5-E6 clone; gray lines, 5′- and 3′-UTRs; black line, ORF.

