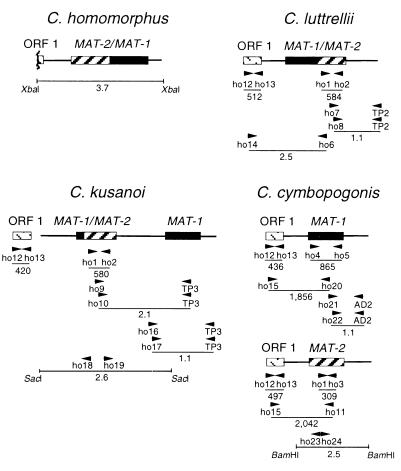
Figure 1.
Strategies to clone MAT genes from homothallic Cochliobolus species, as described in the text. Textures of boxes indicate MAT-1 (black), MAT-2 (hatches), ORF1 (dotted diagonal lines); lines extending from boxes represent sequences flanking idiomorphs. Arrowheads identify locations and 5′ → 3′ direction of PCR primers. Numbers with decimals are in kb, those without are in bp.

