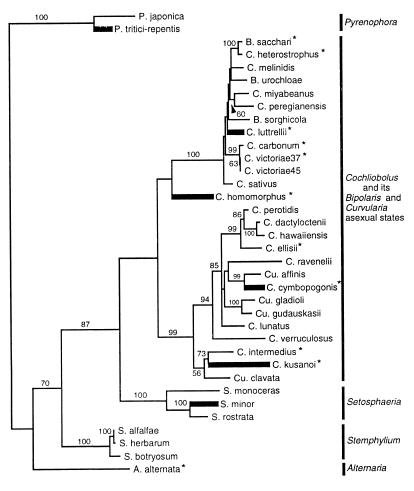
Figure 5.
Maximum likelihood tree generated from combined ITS and GPD sequence data by using paup Version 4.0 d61a (35). Homothallic species (thick lines) are scattered among heterothallic species, indicating their polyphyletic origin. Numbers are percentages (only those over 50 are shown) of times a group was found in 500 parsimony bootstrap replicates. ∗ indicate species from which MAT loci were examined.

