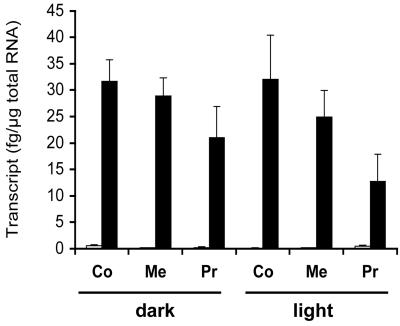
Figure 3.
Real-time PCR quantification of ZmNIT1 (white bars) and ZmNIT2 (black bars) transcript levels in light- or dark-grown seedlings 4 d after germination. The values indicate the transcript level in femtogram per micrograms of total RNA; n = 3. Co, Coleoptile tip; Me, mesocotyl; Pr, primary root tip.

