
Figure 2.
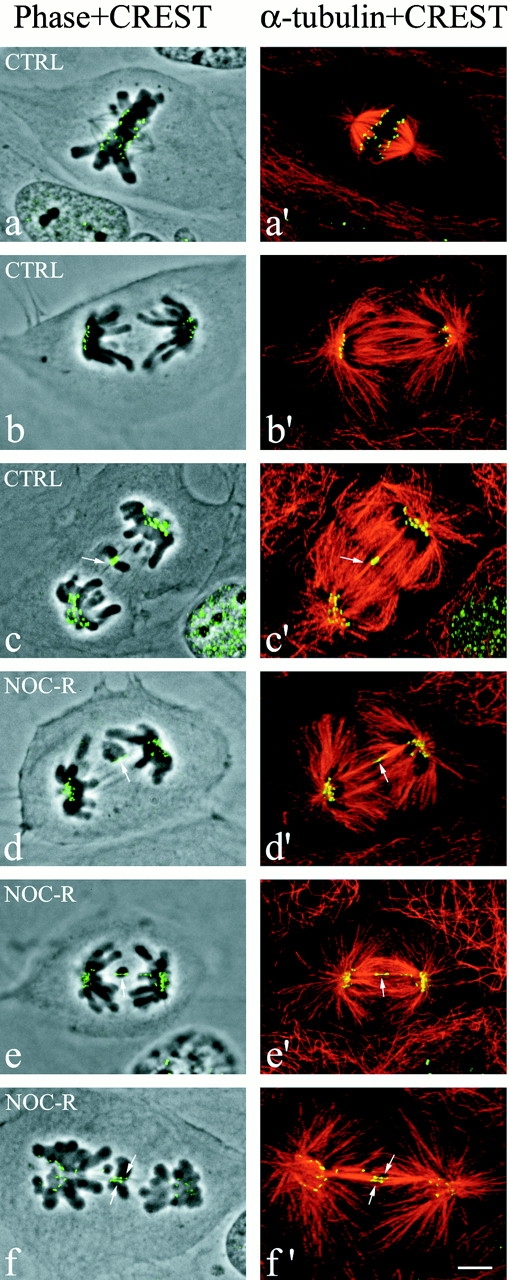
Fluorescent and phase–contrast images of PtK1 cells fixed at anaphase and immunostained for kinetochores with CREST antibody and for microtubules with anti–α-tubulin antibody. The overlay of phase–contrast and CREST images (left column) and α-tubulin and CREST images (right column) is shown. The CREST and microtubule fluorescent images were obtained by projecting into a single image the maximal brightness at each pixel location through a stack of optical sections acquired at 0.2-μm intervals through the immunostained cells by confocal fluorescence microscopy. (a and a′) Normal metaphase. Sister kinetochores exhibit punctuate CREST fluorescence and they appear completely separated from each other because of the stretching induced on centromeric chromatin. (b and b′) Normal anaphase. (c and c′) Example of a lagging chromosome in an untreated anaphase cell (arrows point at the kinetochore of the lagging chromosome). (d–f′) Examples of single or multiple lagging chromosomes in anaphase cells during recovery from a nocodazole-induced mitotic block (arrows point at the kinetochores of lagging chromosomes). The CREST- and α-tubulin–merged images show clearly that the kinetochores of lagging chromosomes in anaphase are connected to microtubules coming from both poles (merotelic attachment) and that the CREST-stained region is stretched compared with the kinetochores correctly localized to the spindle poles. Bar, 5 μm.