
Figure 3.
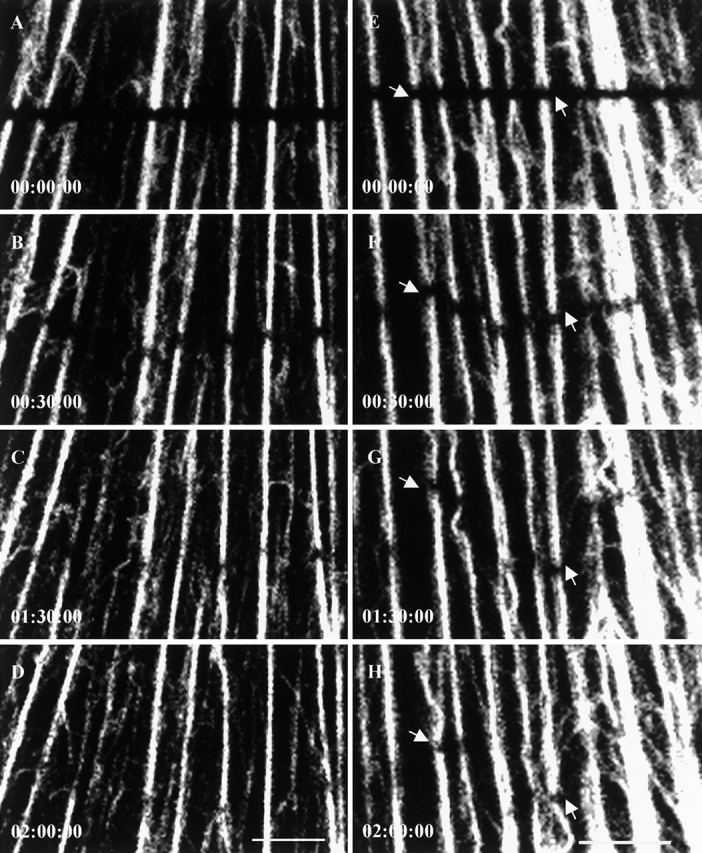
FRAP analyses of tonofibrils containing GFP-K8 (A–D) and GFP-K18 (E–H) in live PtK2 cells. Bar-shaped regions are photobleached, and fluorescence recovery is monitored at 15-min intervals. Bleached tonofibrils recover their fluorescence within 2–3 h. During recovery, some bleach zones (A–D) are relatively stationary and others (E–H) move. Frequently, bleach zones made across individual tonofibrils move at different speeds and in different directions during recovery (arrows). Elapsed time (h:min:s) is indicated at the lower left of each confocal image. Neither the fluorescence recovery rate nor the rate of bleach zone movement appear to be related to tonofibril thickness. Video available at http://www.jcb.org/cgi/content/full/153/3/503/DC1. Bars, 5 μm.