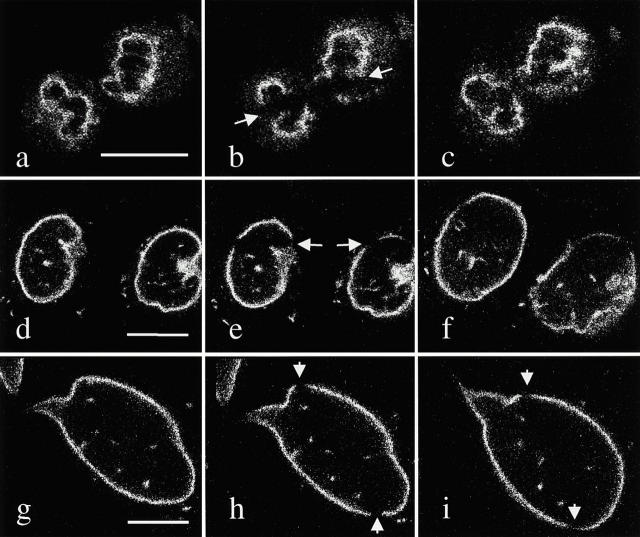
Figure 6.
FRAP experiments were carried out on PAM cells expressing GFP-lamin B1 as nuclear assembly begins in late telophase and into G1. A bar-shaped bleach zone was made across the daughter cells and the recovery rate monitored in each of the forming nuclei. For each daughter cell, two bleach zones are introduced in the lamina rim. The recovery rate for each of these zones was estimated and averaged for each cell. For each time point, the prebleach image (a, d, and g), the immediate postbleach image (b, e, and h), and an image taken during the recovery period (c, f, and i) are shown. (a–c) The same nuclei before photobleaching at 10 min after lamin B enclosure (a), immediately after the introduction of a bleach zone (b, arrows), and 10 min after photobleaching (c), at which time the bleached area has almost completely recovered. (d–f) The same daughter cell nuclei immediately before photobleaching at 20 min after lamin B enclosure (d), immediately after photobleaching (e, arrows), and during recovery (f, 65 min after bleaching). During this period, daughter cell nuclei grew and tended to alter their positions slightly. (g–i) The same daughter cell nucleus at 45 min after lamin B enclosure (g), immediately after bleaching (h, arrows), and 180 min later (i, arrows). Only one daughter cell is shown due to the increase in nuclear size. After 180 min (i), the bleach zone shows only partial recovery (arrows). Bars, 10 μm (a–f) and 5 μm (g–i).

