
Figure 3.
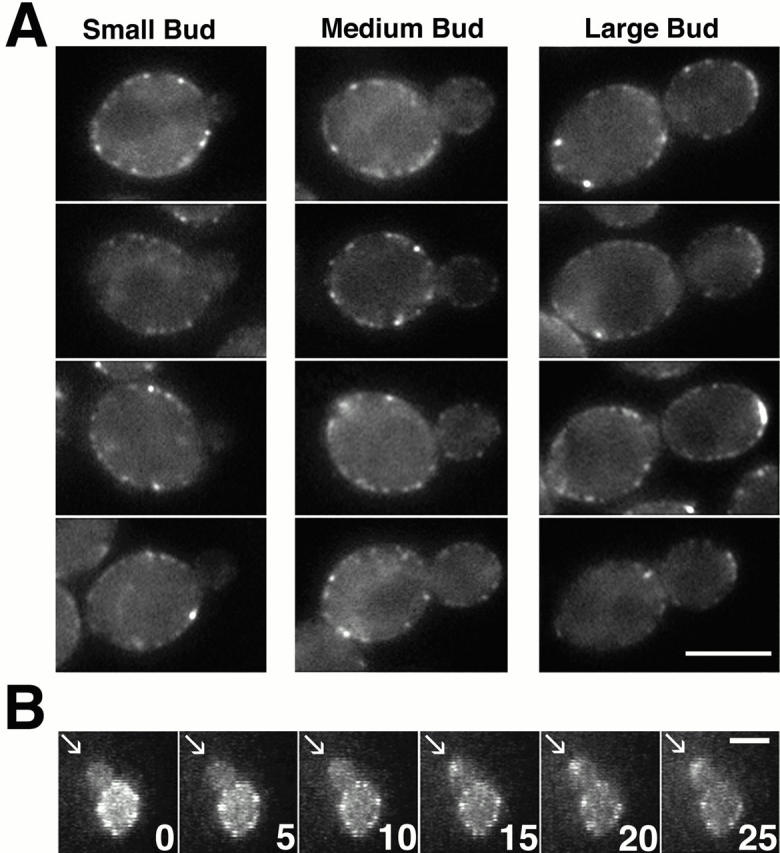
Num1p localization. A, Representative cells expressing Num1–GFP are shown. Bar, 5 μm. B, Num1–GFP localization in a single cell over time. 16 focal planes were collected every minute in diploid cells expressing Num1–GFP and projected to two dimensions. Shown are frames at 5 min intervals. At t = 0 the mother has bright cortical spots and the bud has no staining. The spots in the mother do not move. At 15 min, a small amount of fluorescence staining appears at the bud tip. The bud tip staining enlarges over time (arrow). Bar, 5 μm.