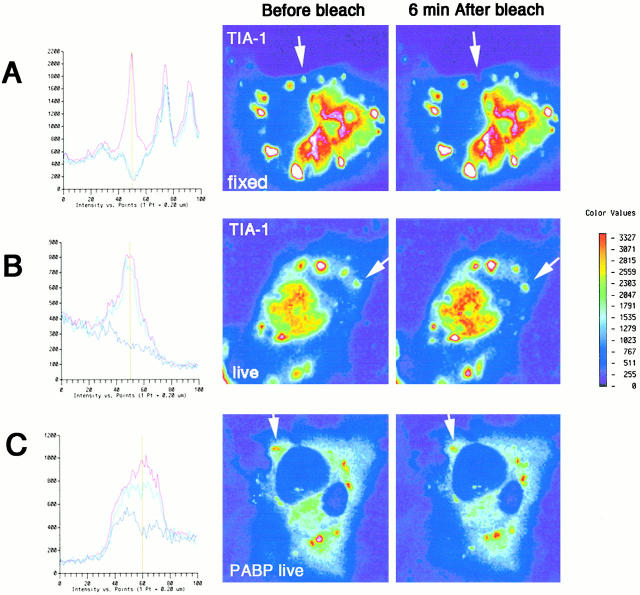
Figure 7.
Fluorescence recovery after photobleaching. Fluorescence microscopy of arsenite-treated (0.5 mM, 30 min) COS cells expressing GFP–TIA-1 (A and B) or GFP–PABP-I (C). Formaldehyde-fixed cells are viewed in A. Live cells are viewed in B and C. (left) Fluorescence intensity across a linear scan centered on the individual SG identified in the fluorescence micrograph shown in the right panel. Red, intensity before photobleach treatment; violet, 0.65 s after photobleach; blue, 22 s after photobleach. (right) Pseudocolor photomicrographs of COS transfectants before and 6 min after photobleaching. Arrows indicate the targeted SGs.

